A-range shares in the two term releases
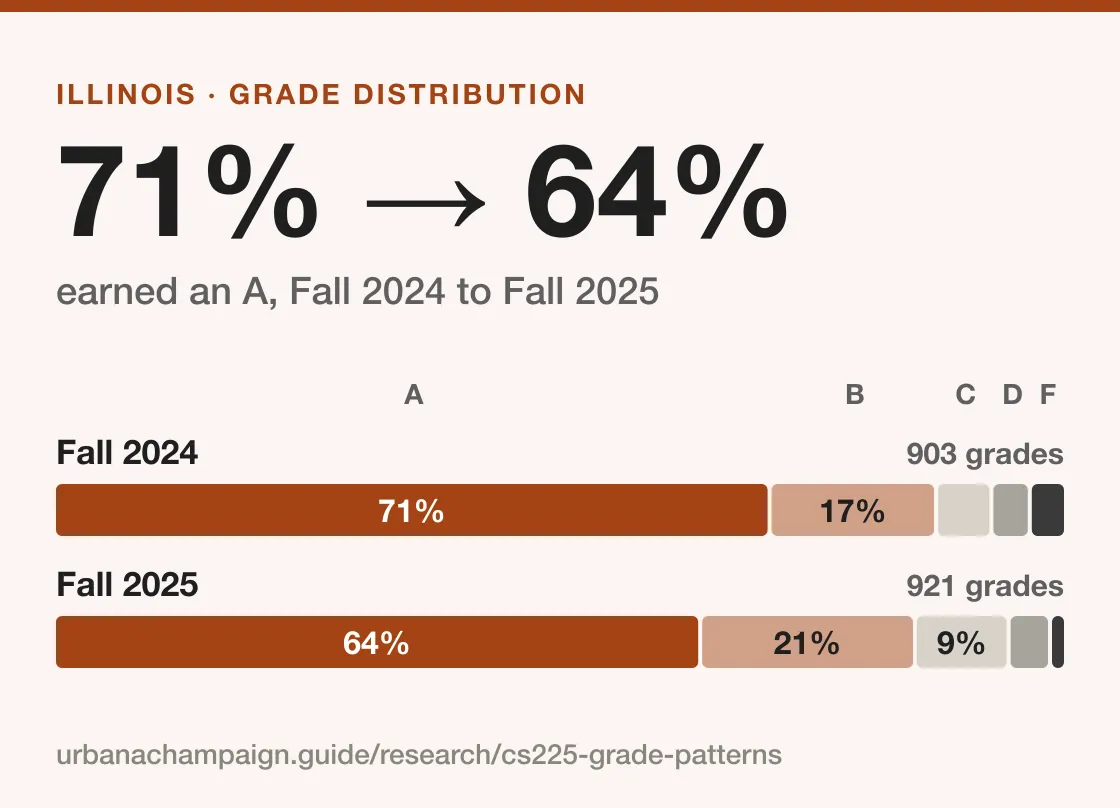
Each release identifies lecture AL1: 903 letter grades in Fall 2024 and 921 in Fall 2025.
- Fall 202471.0% · 641/903
- Fall 202564.1% · 590/921
One released CS 225 lecture group in each of Fall 2024 and Fall 2025.
Sources Fall 2024 official DAIR crosstabFall 2025 official DAIR crosstab
The rest of the grade mix
F grades accounted for 3.2% (29/903) in Fall 2024 and 1.2% (11/921) in Fall 2025. Read the A-range change alongside this full distribution.
| Grade range | Fall 2024 | Fall 2025 |
|---|---|---|
| A range | 71.0% (641/903) | 64.1% (590/921) |
| B range | 16.5% (149/903) | 21.3% (196/921) |
| C range | 5.5% (50/903) | 9.3% (86/921) |
| D range | 3.8% (34/903) | 4.1% (38/921) |
| F | 3.2% (29/903) | 1.2% (11/921) |
Withdrawals: 4 in Fall 2024; 6 in Fall 2025. They are reported separately from letter grades.
Download data (CSV)
Sources Fall 2024 official DAIR crosstabFall 2025 official DAIR crosstab
Use the history alongside current course details
Use these released outcomes as historical context when planning CS 225. Search the current course directory for requirements, meeting times and official registration actions.
The students, assessments, teaching and section composition can differ between terms. These counts alone do not establish why the grade mix changed.
How we did the analysis
- One released CS 225 lecture group in each of Fall 2024 and Fall 2025; exact course, lecture schedule type and published section label.
- Sum the literal A-range grade counts, then divide by the sum of the declared letter-grade bins. Recompute shares from counts rather than averaging percentages or using the reported grade average.
- All 13 declared letter-grade bins are explicitly present in these two source groups, with withdrawals provided separately. Missing or suppressed cells are not replaced with zero.
- Published outcomes are not enrollment counts or unique students across courses.
- The public release can omit protected groups. This comparison covers these released lecture groups, with no cross-listed course or instructor-name joins.
- A repeated CRN in different terms does not identify the same students or prove continuity of a section or instructor.
- Offline replay of retained official term crosstabs; no new source retrieval; source qualification date 2026-11-17. Observation periods remain the two named terms.
Download the analyzed data
The files below contain the observations and comparisons used in this report.
Sources
- University of Illinois Data, Analytics, and Institutional Research: grade-distribution dashboard · Official section-grade definitions and crosstab downloads
- Fall 2024 official DAIR crosstab · CS 225 · LEC · AL1 · CRN 35917
- Fall 2025 official DAIR crosstab · CS 225 · LEC · AL1 · CRN 35917
Cite this report
Urbana–Champaign Field Guide. 2026. “How common were A-range grades in CS 225 AL1?.” Urbana–Champaign Field Guide. https://urbanachampaign.guide/research/cs225-grade-patterns/